Wine Labs · Market intelligence
Wine Price History Explained
Learn how to read wine price history across benchmarks and sales channels, avoid common data traps, and turn trends into practical decisions.
The most popular advice about wine price history is also the least reliable: find a chart, identify the direction of the line, and assume you've found the market value. A chart can rise because a scarce auction lot changed hands, fall because a currency moved, or appear stable because incompatible vintages and formats were pooled together. Before a retailer sets an ask, a collector sells a bottle, or an investor evaluates a holding, the first question should be whether the underlying observations are comparable.
Fine wine pricing is therefore a measurement problem before it's a performance problem. Identity, channel, timing, currency, format, condition, and the difference between an offer and an executed trade all determine what a price point means. The history becomes useful only after those variables have been made explicit.
Table of Contents
- Why a Single Wine Price Line Can Mislead
- Understanding Wine Price History
- Building a Comparable Market Dataset
- Reading Trends and Channel Differentials
- What Historical Benchmarks Reveal
- Adjusting Prices and Avoiding False Signals
- Applying Price History Across Business Decisions
- Turning Price History Into a Decision System
<a id="why-a-single-wine-price-line-can-mislead"></a>
Why a Single Wine Price Line Can Mislead
One uninterrupted line suggests that a wine has one objective market price at every moment. In practice, the line may combine retail asks, auction hammer prices, brokered transactions, and release offers that describe different events. A retailer listing the same Bordeaux at EUR 320 and GBP 285 doesn't necessarily show a market divergence. It may show two currencies, two channels, different tax treatments, or different timestamps.
The same problem appears when a Hammer Auction result records GBP 410 while a négociant offers EUR 380 per six-bottle OWC. The first is an executed auction outcome for a particular lot, potentially reflecting urgency, provenance, and buyer competition. The second is a commercial release price for a defined case format. Treating both as interchangeable observations can manufacture volatility that never existed.
<a id="identity-comes-before-arithmetic"></a>
Identity comes before arithmetic
Canonical matching means deciding whether two records really describe the same asset. The producer, cuvée, label, vintage, bottle size, case configuration, and presentation must align before prices can enter one series. A label variant or an incorrectly mapped vintage can distort the apparent history more severely than an ordinary market fluctuation.
The need for this discipline is supported by research examining 113,761 transaction records across Liv-ex, auction, and OTC venues from 2005 to 2015, which found that the same wine could trade at materially different levels depending on the venue. The findings are summarized in the cross-venue fine-wine pricing research.
For a merchant, an unnormalized chart can produce a bad buy price. A collector may mistake a high hammer result for a sustainable resale level. An investor may benchmark an asset against an index that measures a different channel entirely.
Practical rule: A price point isn't useful because it looks precise. It's useful because you can explain exactly what changed hands, where, when, and in what condition.
Currency normalization and condition accounting complete the basic test. Convert currencies using the trade-date basis, express cases on a consistent per-bottle basis, and separate sound stock from bottles with compromised labels or ullage. Without those controls, the chart measures record-keeping differences as much as it measures wine value.
<a id="understanding-wine-price-history"></a>
Understanding Wine Price History
Think of a wine price history like a blood-pressure chart for one patient, not an average for an entire population. Each reading needs a known patient, a consistent method, and a timestamp. A wine chart needs the same discipline: the same canonical wine, a defined condition, a known channel, and a clear unit.
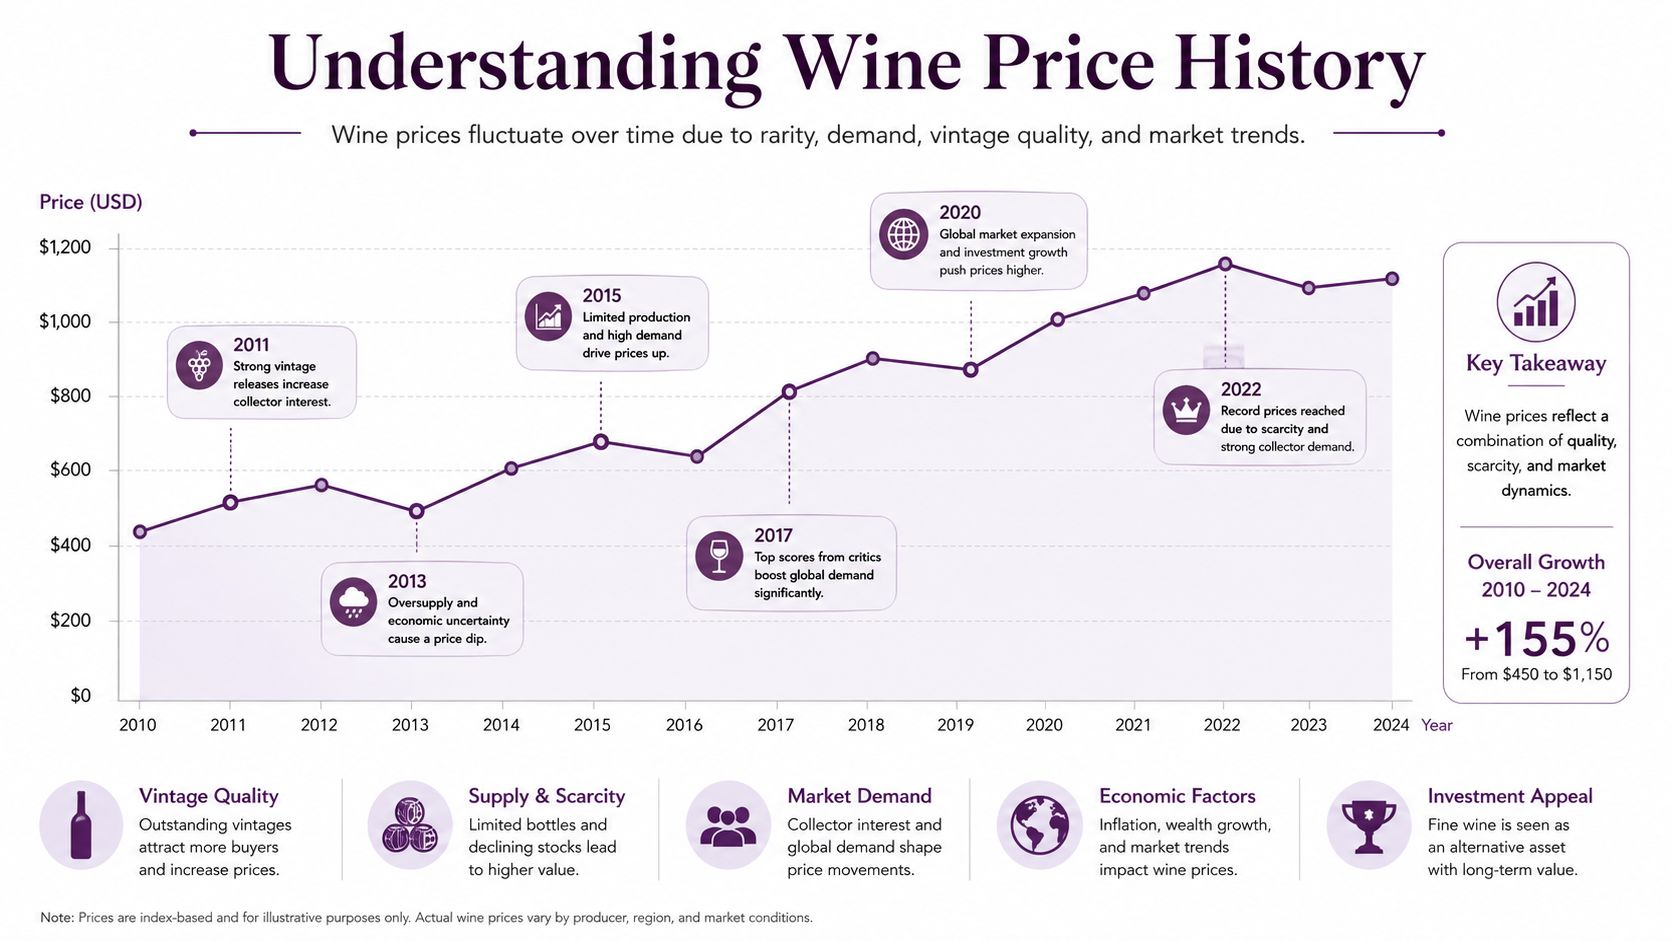
A price observation is a single ask or transaction. An ask records what a seller wants, while an executed trade records what a buyer paid. A benchmark aggregates observations into a defined series, often by tracking a basket rather than one bottle. The Liv-ex Fine Wine 100, for example, was officially launched in December 2003 and backdated to July 2001, creating a comparable series for 100 sought-after wines on the secondary market, as described in this history of the Liv-ex Fine Wine 100.
<a id="four-questions-give-a-chart-meaning"></a>
Four questions give a chart meaning
Before interpreting a claimed movement such as “prices rose 12% last year,” ask:
- Does the identity match? Confirm producer, cuvée, label, vintage, and any relevant classification.
- Is the format identical? A single 750 ml bottle, a six-bottle case, and a 12-bottle case shouldn't enter the series without unit normalization.
- Where did the price originate? Retail, auction, exchange, OTC, restaurant, and négociant prices reflect different participants and incentives.
- What adjustment basis applies? State the currency, inflation treatment, condition rules, taxes, and delivery status.
The distinction between nominal and comparable value matters throughout the analysis. A headline price can rise in its original currency while losing purchasing power after inflation, or appear to outperform because the currency conversion changed. The long-run Bordeaux study covering 36,000 First Growth prices from 1899 to 2012 found that inflation-adjusted values were flat in the early twentieth century, surged around World War II, and later entered a sustained growth regime. Its methodology and findings are discussed by the Cambridge Judge Business School study of wine prices.
A chart becomes evidence only when its construction is visible. Otherwise, the percentage may be mathematically correct but economically meaningless.
<a id="building-a-comparable-market-dataset"></a>
Building a Comparable Market Dataset
Fine-wine data sources answer different questions, so aggregation shouldn't begin with the assumption that every price is equivalent. A transaction-based exchange index provides a more continuous reference for traded wines. Auction results reveal executed hammer prices and scarcity effects, but individual lots can carry unusual provenance or buyer urgency. OTC broker prints can expose negotiated liquidity, while retail and négociant listings show replacement cost or seller intent rather than necessarily completed demand.
Restaurant wine lists measure another commercial context. They can indicate how a venue prices a bottle for consumption, service, storage, and hospitality overhead, but they shouldn't be treated as a direct substitute for a secondary-market trade.
<a id="what-each-stream-contributes"></a>
What each stream contributes
| Data stream | What it measures | Main caution |
|---|---|---|
| Exchange-style transactions | Observable traded prices | Coverage follows actively traded wines |
| Auction results | Lot-level executed outcomes | Hammer prices can reflect lot and provenance effects |
| OTC prints | Negotiated market activity | Prints may be less continuously visible |
| Retail and négociant listings | Seller asks or release offers | Asking prices aren't completed trades |
| Restaurant lists | Consumer-facing commercial pricing | Service and venue economics influence the number |
The research on pricing across Liv-ex, auction, and OTC venues is particularly useful because it demonstrates that venue choice affects observed price history. A dataset that ignores venue can confuse market microstructure with appreciation.
<a id="canonical-matching-is-the-foundation"></a>
Canonical matching is the foundation
A usable dataset first links heterogeneous descriptions to one canonical record. That record should resolve producer, label, vintage, format, case size, and relevant packaging details. It should also retain the original observation, so an analyst can trace a normalized point back to its source rather than losing the context during aggregation.
Wine Labs describes its fine-wine market data platform as consolidating retail, auction, exchange, and restaurant pricing into a comparable view. The analytical value of that approach isn't just the number of sources. It's the ability to separate channel observations, normalize units and currencies, and show whether a movement appears across the market or only in one venue.
A merchant can then distinguish a genuine change in replacement cost from a single stale listing. An analyst can compare an auction result with contemporaneous retail asks without pretending they are identical. A buyer can see whether an apparent discount survives after format, condition, and channel adjustments.
The result should be a dataset that preserves differences before it summarizes them. Aggregation becomes useful only after the records have been matched and the reasons for their differences have been retained.
<a id="reading-trends-and-channel-differentials"></a>
Reading Trends and Channel Differentials
A wine price chart should be read at more than one horizon. A short window is sensitive to isolated trades, stale offers, and temporary liquidity. A long window can reveal the cycle, but it may hide the moment when a vintage or region changes direction. The correct horizon depends on the decision. A merchant needs current replacement signals, while an investor may need a longer real-return history.
Percentage changes make unlike-priced wines easier to compare than raw currency differences. A movement of the same monetary amount has a different meaning for a modestly priced wine and a high-value bottle. Rolling 12-month returns can also reveal a change in momentum that an annual snapshot misses, provided the series has enough consistent observations.
<a id="read-the-spread-as-well-as-the-line"></a>
Read the spread as well as the line
Channel differentials often contain the decision signal. An auction hammer price can sit above or below a retail ask because buyers value immediate availability, provenance, or a specific lot, while retailers carry overhead and may price for future replacement. A merchant studying Bordeaux should compare the négociant release, en primeur secondary activity, and retail shelf rather than relying on one blended line.
Volatility adds a second layer. Standard deviation of monthly returns can separate a relatively steady allocation wine from a thinly traded or speculative lot, but only when the underlying observations are sufficiently regular. Sparse data can make a stable wine look calm because little has traded, or make an active wine look volatile because one unusual print dominates the month.
The width of the spread can matter more than the direction of the trend.
A practical reading process looks like this:
- Start with the horizon: Match the chart period to the purchase, sale, replenishment, or allocation decision.
- Separate asks from trades: Use listings to understand seller intent and executed prices to assess realized liquidity.
- Track channel spreads: Compare auction, retail, exchange, and release observations instead of hiding them inside one average.
- Set an observation threshold: A point based on one outlying trade shouldn't carry the same confidence as a point supported by repeated activity.
- Inspect the vintage: A regional index can rise while an individual vintage weakens, or the reverse.
This approach prevents a common error. A retailer may see a rising auction line and raise its shelf price, even though the retail channel hasn't confirmed the movement. Conversely, a collector may see lower retail asks and assume the wine's value has collapsed, when the offers reflect slow turnover rather than executed sales.
<a id="what-historical-benchmarks-reveal"></a>
What Historical Benchmarks Reveal
Benchmark history shows why a straight-line view of wine value fails. Liv-ex created its first benchmark fine-wine index from real-time transactional data, launching the Fine Wine 100 in 2004 and backdating it to July 2001, according to the Liv-ex explanation of the Fine Wine 100. Liv-ex also reports that its broader indices have tracked prices of the world's most traded fine wines since 2000, using transaction-based mid prices, as summarized in the Liv-ex Fine Wine 100 reference.
The series captures a market that expands, corrects, and changes leadership. It grew through the mid-2000s, contracted during the 2008 financial crisis, and rebounded sharply as Asian collector demand strengthened in 2010 and 2011. That history is more useful than a long-run average because it shows that the same asset class can behave differently under different liquidity and demand regimes.
<a id="recent-readings-need-a-defined-benchmark"></a>
Recent readings need a defined benchmark
The broader Liv-ex Fine Wine 1000 stood at 350.7, with a 1-year change of 1.2%, but remained down 7.9% over five years, according to the Fine Wine 100 history and index summary. The message is precise: a recent stabilization doesn't erase a medium-term drawdown.
Bordeaux offers a more concentrated example. The WD Bordeaux 100 covers 100 wines from 14 vintages and represents approximately EUR 2 billion in value. In January 2025, it declined 1.2% for the month and 5.5% over the previous year, while the broader 2003 to 2020 Bordeaux price index stood at 1836, below its maximum of 2094. By March 2026, the 2003 to 2022 Bordeaux price index was reported at 1709, down 5.6% year over year and 5.9% on a five-year-per-year basis, as shown in the WD Bordeaux index analysis.
These benchmarks don't describe every bottle. They describe defined baskets. The long-run study of First Growths estimated a real annualized fine-wine return of 4.1% net of operating costs, compared with 2.4% for art, 2.8% for stamps, and 5.2% for equities, as reported by Cambridge Judge Business School. Such figures are useful context, not a promise for an individual holding.
<a id="adjusting-prices-and-avoiding-false-signals"></a>
Adjusting Prices and Avoiding False Signals
Raw prices contain several hidden variables. A 12-bottle case, a six-bottle case, and a single bottle may all be reported as if they were interchangeable, even though lot size affects buyer participation and per-bottle economics. Normalize the unit first, then retain the original lot structure so the analyst can test whether case size is influencing the outcome.
Condition needs similar treatment. Ullage, label state, capsule damage, storage history, and provenance can change the price of two otherwise identical bottles. Pooling sound stock with compromised stock systematically understates the value of the better bottles and may overstate the value of the weaker ones.
<a id="adjustments-that-protect-the-series"></a>
Adjustments that protect the series
Currency conversion should use the trade date rather than a later month-end rate. Otherwise, exchange-rate movement can appear as wine appreciation or depreciation. The same discipline applies to taxes, buyer's premiums, delivery charges, and whether an auction number is a hammer price or an all-in result.
Vintage comparisons require restraint. A strong vintage can command a quality premium that disappears when it is blended with a weaker year. Comparing identical or near-identical vintages preserves that signal, while broad aggregation can flatten it.
Release-price comparisons create a separate timing issue. En primeur pricing refers to wine sold before delivery, while a delivered bottle trades after production, storage, and release conditions have changed. Comparing those points without matching delivery status can make a normal timing gap look like a return.
A larger dataset isn't automatically a better dataset. Filtering incompatible observations often improves the decision more than adding another feed.
Event flags help isolate unusual windows, including Burgundy release shocks, failed Bordeaux campaigns, tariff changes, or pandemic-era disruption. The Cellar Pricer workflow is relevant when valuation requires matching a cellar file to market records rather than applying a broad index to every bottle.
Ignoring these adjustments creates predictable errors. A case sold at auction may overstate a single-bottle resale expectation. A currency swing may exaggerate a return. A release comparison may understate the cost of capital and time. Disciplined filtering makes the remaining price history narrower, but much more defensible.
<a id="applying-price-history-across-business-decisions"></a>
Applying Price History Across Business Decisions
The same normalized history supports different decisions, but each user should apply a different filter. A merchant wants a competitive price and reliable turnover. A collector wants fair replacement value and a defensible sale window. An investor needs real returns, liquidity evidence, and risk controls. A marketplace operator needs fair-value ranges that can withstand messy seller inputs.
<a id="merchant-workflow"></a>
Merchant workflow
A merchant should begin with current executed trades and nearby retail asks, then compare the spread across formats and channels. If the benchmark is firm but retail inventory remains plentiful, raising the ask may slow turnover rather than improve margin. If auction evidence strengthens while replacement offers lag, the merchant may have an opportunity to replenish before suppliers reprice.
The key output is not a single “correct” price. It's a range with confidence based on identity quality, recency, channel agreement, and observation depth.
<a id="collector-workflow"></a>
Collector workflow
Collectors should build a vintage-level record for each bottle, including provenance, condition, format, and acquisition date. That record helps distinguish a personal cellar's insurance value from a likely liquidation value. It also supports acquisition timing, because a broad market correction doesn't mean every vintage has become equally attractive.
<a id="investor-workflow"></a>
Investor workflow
Investors should prioritize executed-trade series over listings and examine compounded real returns alongside rolling volatility. The historical First Growth dataset found a 4.1% real annualized return net of operating costs for fine wine over its study period, compared with 5.2% for equities, but that comparison doesn't remove storage, insurance, taxes, liquidity, or selection risk. The source is the Cambridge Judge Business School wine-price study.
<a id="marketplace-workflow"></a>
Marketplace workflow
A marketplace can use canonical records to flag duplicate listings, identify outliers, and present a fair-value range instead of endorsing every seller ask. Its confidence threshold should rise when the wine is thinly traded, the channel spread is wide, or condition information is incomplete.
Each workflow uses the same market observations differently. Time horizon, channel mix, and confidence rules should be documented rather than hidden inside a chart.
<iframe width="100%" style="aspect-ratio: 16 / 9;" src="https://www.youtube.com/embed/9bVJI1ua3P8" frameborder="0" allow="autoplay; encrypted-media" allowfullscreen></iframe><a id="turning-price-history-into-a-decision-system"></a>
Turning Price History Into a Decision System
A trustworthy wine price history should answer six questions before anyone acts:
- Identity: Which producer, label, vintage, format, and packaging does the record represent?
- Channel: Is the observation an auction, exchange, OTC, retail, restaurant, or release price?
- Unit: Has the record been normalized for bottle count, currency, taxes, and premiums?
- Condition: Are provenance, ullage, label state, and storage treated consistently?
- Timing: Is the timestamp precise enough to connect the price with the market event?
- Evidence type: Is the number an asking price or an executed trade?
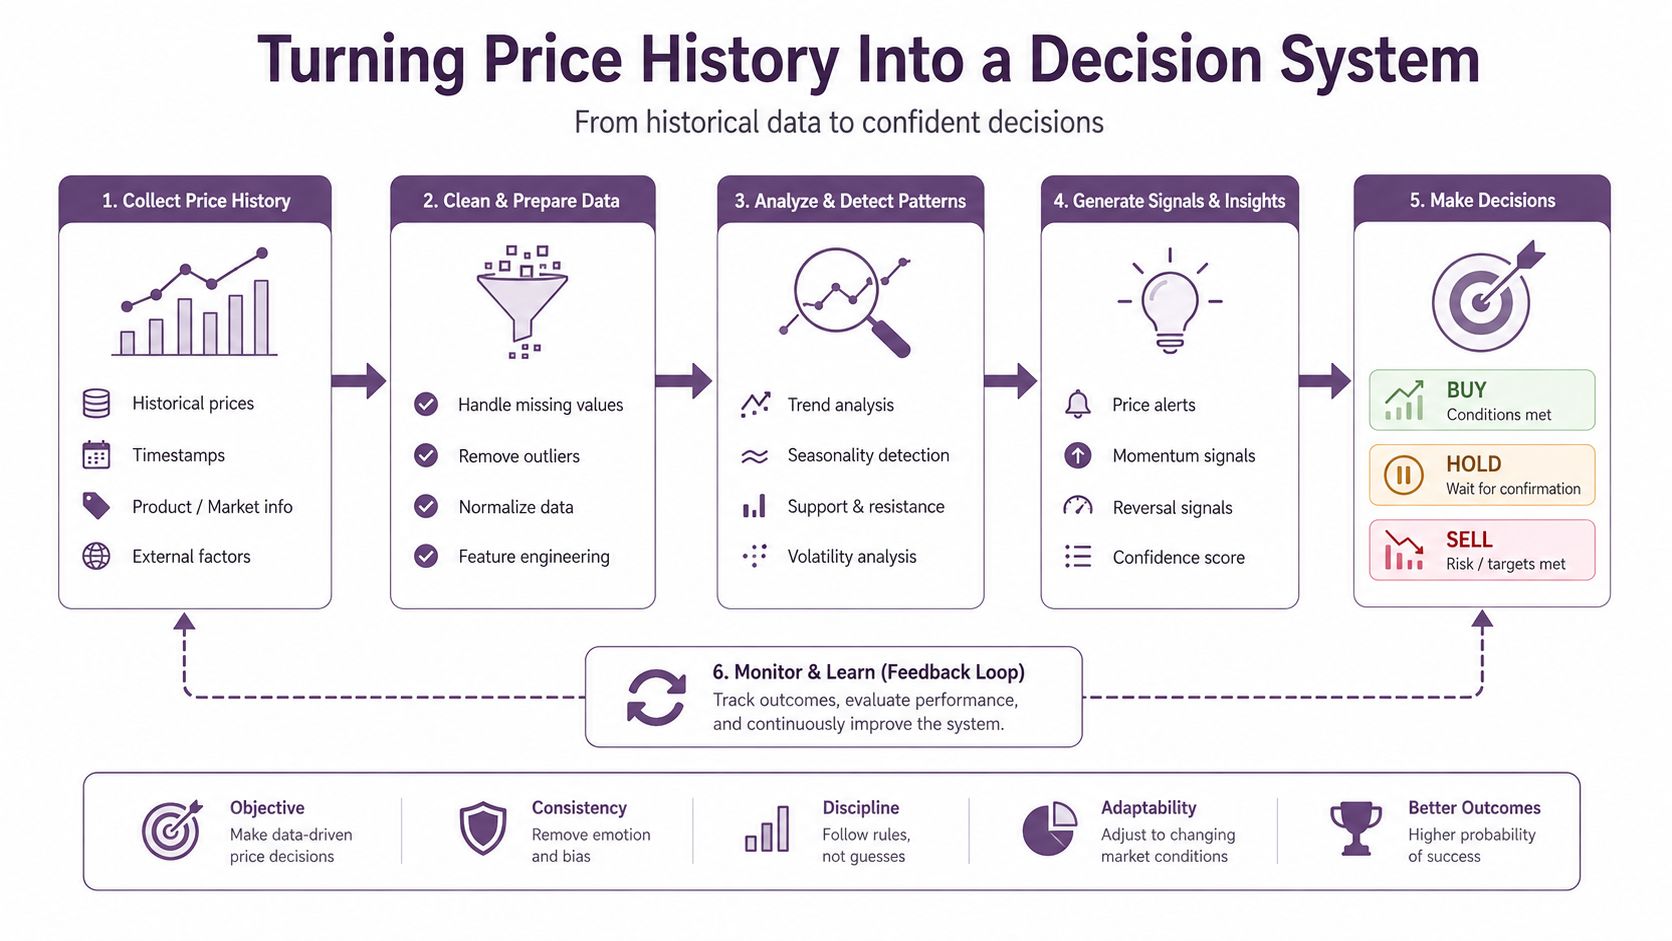
Once those fields are controlled, the chart becomes an operating tool rather than a decorative line. Canonical matching links different descriptions to one wine, cross-channel aggregation exposes whether a movement is broad or isolated, and alerts can identify threshold breaches or unusual channel spreads. Programmatic delivery through a market data API can place normalized history inside a merchant system, valuation workflow, or portfolio dashboard.
The central conclusion is simple: wine price history isn't just a record of changing numbers. It's a record of changing numbers that must remain comparable. The strongest decisions come from preserving the distinctions between channels while making the underlying wine identity consistent.
Wine Labs consolidates fine-wine pricing across retail, auction, exchange, and restaurant channels, with historical tracking and tools for pricing, sourcing, and portfolio valuation. Visit Wine Labs to examine comparable market data and turn fragmented price observations into a decision-ready workflow.