Wine Labs · Market intelligence
Fine Wine Market Trends: Data-Driven Insights for 2026
Explore the latest fine wine market trends with data-backed analysis of pricing, regional movers, and investment signals to guide smarter decisions in 2026.
The loudest advice in fine wine market trends is usually the least useful: decide whether the market is bullish or bearish, then act accordingly. That framing is too blunt for a category where prices can soften, trading can stay active, and the best opportunities can sit in only a few regions, vintages, or channels. In 2026, the better question is not whether fine wine is up or down, it's where pricing is resilient and where liquidity is building.
That distinction matters because the market has spent the last several years in correction, but not in collapse. Major benchmarks moved lower, yet buyers kept trading. Some regions held up better than others, demand shifted geographically, and the microstructure beneath the headline indices started to improve before prices looked fully healed on the surface. Merchants and investors who read those signals correctly can price more accurately, source more selectively, and avoid confusing a temporary floor with a durable recovery.
Table of Contents
- Why the Fine Wine Market Defies Simple Narratives
- The 2023 to 2025 Correction in Numbers
- Regional Performance and the Recovery Map
- Reading the Microstructure Signals Beneath the Surface
- The New Geography of Fine Wine Demand
- Using Wine Labs Trend Indicators for Smarter Decisions
- Building a Data-First Approach to Fine Wine Markets
<a id="why-the-fine-wine-market-defies-simple-narratives"></a>
Why the Fine Wine Market Defies Simple Narratives
The easiest way to misread the market is to treat it like a single thermometer reading. Fine wine doesn't behave that neatly because region, vintage, channel, and buyer geography all pull prices in different directions at the same time. A broad index can be down while a narrower set of wines is already stabilising, and those two facts are not contradictory.
That's why the familiar bull or bear label falls apart here. The market can be in correction and still have active liquidity. It can be below prior peaks and still reward selective buying. It can even show better trading breadth while average prices remain under pressure, which is exactly why merchants need to separate participation from price direction.
<a id="what-headline-indexes-hide"></a>
What headline indexes hide
Index numbers are useful, but only up to a point. They tell you what happened at the basket level, not where value is being defended. A blue-chip index can flatten out while older vintages, certain appellations, or specific price bands move differently, and that divergence matters more for buying and stocking decisions than a neat market label.
Practical rule: If the market story can be told in one sentence, it's probably too simple for trading decisions.
The same logic applies across channels. Exchange data, retail pricing, auction outcomes, and restaurant lists don't always move together. That's why a merchant quoting from a single source can end up either too slow or too aggressive, depending on which part of the market is setting the tone. In fine wine, the truth sits in the spread between channels, not in the slogan attached to the category.
The broader correction also changed the type of question that matters. Instead of asking whether prices are rising in aggregate, the better question is which part of the market is already behaving like a recovery, and which part is still repricing. That's the lens that separates noise from usable signal.
<a id="the-2023-to-2025-correction-in-numbers"></a>
The 2023 to 2025 Correction in Numbers
The correction that began in 2023 was broad, but the price action did not move in one line. By 2024, the Liv-ex Fine Wine 100 had fallen 9.2% year-to-date, while the Fine Wine 50 and Fine Wine 1000 were both down 11.1%. WineCap's 2024 market outlook showed the same direction across major regions, with fine wine prices down 11% across major regions for the year, which suggests the weakness reached beyond one index construction or one narrow part of the market. WineCap's 2024 market outlook
Trading activity held up while prices were falling. Liv-ex said trade count was 5.5% above 2023, and WineCap reported that the number of fine wine trades in 2024 surpassed 2023 by 7.9% in the same report. That combination points to repricing rather than a market freeze. Buyers and sellers were still meeting, which meant the market kept enough liquidity for price discovery even as valuations came under pressure. The correction was painful for holders of inventory, but it did not remove activity from the market.
WineCap also highlighted regional dispersion. Italy was the most resilient region and Burgundy the weakest, while Rhône wines dominated the best-performing list, led by Domaine Pegau Cuvée Réservée Rouge 2013, which rose 80.5%. The point is straightforward, the average hides a wide spread in outcomes at the wine level. A merchant holding resilient stock and a merchant holding weak Burgundy from the wrong entry point are facing very different realities.
For a useful 2026 reference point, the broader correction also fits the long-cycle data in Wine Labs' Bordeaux price correction and global RTD growth digest, which helps place wine-specific repricing beside adjacent demand shifts. The same pattern shows up there. A falling market can still be liquid, and liquidity is often the first signal buyers should watch.
<a id="regional-performance-and-the-recovery-map"></a>
Regional Performance and the Recovery Map
<a id="different-regions-moved-at-different-speeds"></a>
Different regions moved at different speeds
Regional dispersion is now the main story. Recovery has not arrived as one broad wave, and the clearest opportunities sit where pricing has proved resilient across regions with different starting points. WineCap's 2024 review identified Italy as the most resilient region and Burgundy as the weakest, while the Rhône produced some of the strongest gains among the better-performing wines. That matters because it shows the correction is working through the market unevenly, with local repricing shaped by vintage quality, collector preference, and how far each region had run before the downturn.
Burgundy's weakness is especially telling. The region had already gone through a sharp rise in 2021 and 2022, so the later decline was a reversal from a high base rather than a simple cyclical dip. Italy's relative strength points to categories that entered the correction with firmer support, which is the kind of difference inventory buyers should prioritise when deciding what to replenish first.
A compact view makes the regional pattern easier to read.
| Region | Trend Direction | Key Insight |
|---|---|---|
| Italy | More resilient | Held up better during the correction |
| Burgundy | Weakest | Felt the heaviest pressure after the earlier surge |
| Rhône | Strongest pockets | Better-performing wines were led by Domaine Pegau Cuvée Réservée Rouge 2013 |
| Champagne | Mixed but improving | Showed recovery signs in 2025 and early 2026 |
| Bordeaux | Stabilising | Large, liquid, but still selective |
| Rest of World | Improving participation | Share of wines trading higher stood out in mid-2025 |
<a id="where-the-first-recovery-signals-appeared"></a>
Where the first recovery signals appeared
WineCap said Q3 2025 was the first positive quarter for the market since 2022, and its 2025 review noted that Champagne posted its first month-on-month gain in a year in June, with stabilisation in the second half though the pattern remained uneven by region. That sequence matters. The recovery started with a few regions turning first, then broadened only after those early moves held. WineCap's 2025 review
Mid-2025 data pointed in the same direction. Trading volumes were up 6.3% year-to-date even as prices were down 7% across all regions, Champagne was the best-performing region at down just 5.4%, and the Rest of World category led in the share of wines trading higher versus 2024 at 36%. WineInvestment.com mid-year review
Regional recovery is therefore less about whether the market is up or down, and more about where pricing has held together while volumes and participation changed. A region can still be repricing even when more bottles are changing hands.
That is why allocation matters so much in fine wine. Treating Bordeaux, Burgundy, Champagne, Italy, and Rhône as one trade risks missing where buyer support is forming.
<a id="reading-the-microstructure-signals-beneath-the-surface"></a>
Reading the Microstructure Signals Beneath the Surface
<a id="bid-and-offer-behavior-often-turns-before-the-price-does"></a>
Bid and offer behavior often turns before the price does
The strongest clue that the market floor is improving is not a headline index move, it's the quality of the two-sided market. In Q1 2026, WineCap said the bid:offer ratio on the Liv-ex Fine Wine 100 rose from 0.87 to 1.1, the highest since October 2022, while 62% of Liv-ex trades were buyer-initiated, the highest share since Q1 2024. That combination matters because tighter spreads and higher buyer-initiated activity usually show that real demand is stepping in before a full price rebound becomes obvious. WineCap Q1 2026 report
The same report also said the Liv-ex 100 had posted six consecutive months of gains into early 2026. That doesn't mean the market has erased the earlier drawdown, but it does mean buyers were willing to defend levels for long enough to create a more credible floor. In practical terms, sellers are no longer moving in a vacuum.
<a id="why-microstructure-beats-mood"></a>
Why microstructure beats mood
A market can feel weak and still be structurally healthier than it looks. That's because sentiment lags actual order flow, and fine wine is especially sensitive to this gap. A merchant watching only public commentary can miss the point that buyers are already leaning in, while a trader watching only price direction can miss the fact that spreads are tightening and deal flow is improving.
The important shift in 2025 and early 2026 is that market health became visible in the mechanics first. That's why tools that track trade composition, bid depth, and channel-level repricing matter more than a generic “market sentiment” read. If you want a practical framework for reading those signals, the auction digest is useful because it captures how demand shows up across lots and categories before the broader market summary catches up.
If buyer-initiated trades are rising while spreads narrow, the market is telling you demand is no longer hypothetical.
That's the lesson from the microstructure data. Don't wait for headlines to confirm recovery. By then, the better entry points are usually gone.
<a id="the-new-geography-of-fine-wine-demand"></a>
The New Geography of Fine Wine Demand
The old assumption that fine wine demand is anchored in a small set of investment hubs is too simple for the current market. A 2026 industry article argued for a new geography of fine wine demand, with growth coming from a wider set of buyers rather than a narrow group of legacy centers. That matters because it changes where price discovery happens, which labels clear quickly, and where supply can be absorbed without forcing discounts. The new geography of fine wine demand
The supply and demand map makes the point clearer. Bain and Altagamma estimated the fine wine market at about €30 billion in 2024, while also showing that Europe produced 75% of fine wines in 2023 and Europe plus the Americas consumed 80%. They also noted that APAC and MEA accounted for only 5% of production and 20% of demand, even though those regions were identified as growth markets. Bain market release
That gap between production and consumption has direct trading consequences. As demand spreads beyond the traditional Western buyer base, sellers face more than a larger pool of bids. They face different buying behavior across regions. Some markets bid hardest on prestige names, some move faster through auction, and some show a stronger preference for accessible bottles than for trophy labels. The result is a more segmented pricing structure, with different clearing prices by channel and region rather than one global benchmark.
<a id="what-the-geographic-shift-means-in-practice"></a>
What the geographic shift means in practice
A key question for merchants is how that shift changes execution.
- Pricing power shifts: Regions that can absorb more supply can sustain firmer bids on wines with local relevance.
- Liquidity becomes channel-specific: Some wines clear more efficiently in exchange markets, others through auction or retail.
- Inventory strategy changes: Stock that looks ordinary in one geography can become scarce in another if collector preference shifts there.
Independent market coverage has also pointed to Asia as a larger demand center than older narratives suggest. One forecast put the Asia Pacific region at 35.8% of the global fine-wine market. That does not mean Europe or the U.S. lose relevance. It means the market's center of gravity is more distributed, and the strongest pricing pockets may sit outside the regions that still dominate the traditional conversation.
For merchants and investors, the implication is straightforward. If demand is moving across geographies, pricing power follows those flows, and the best opportunities will not always be in the places that attract the most attention.
<a id="using-wine-labs-trend-indicators-for-smarter-decisions"></a>
Using Wine Labs Trend Indicators for Smarter Decisions
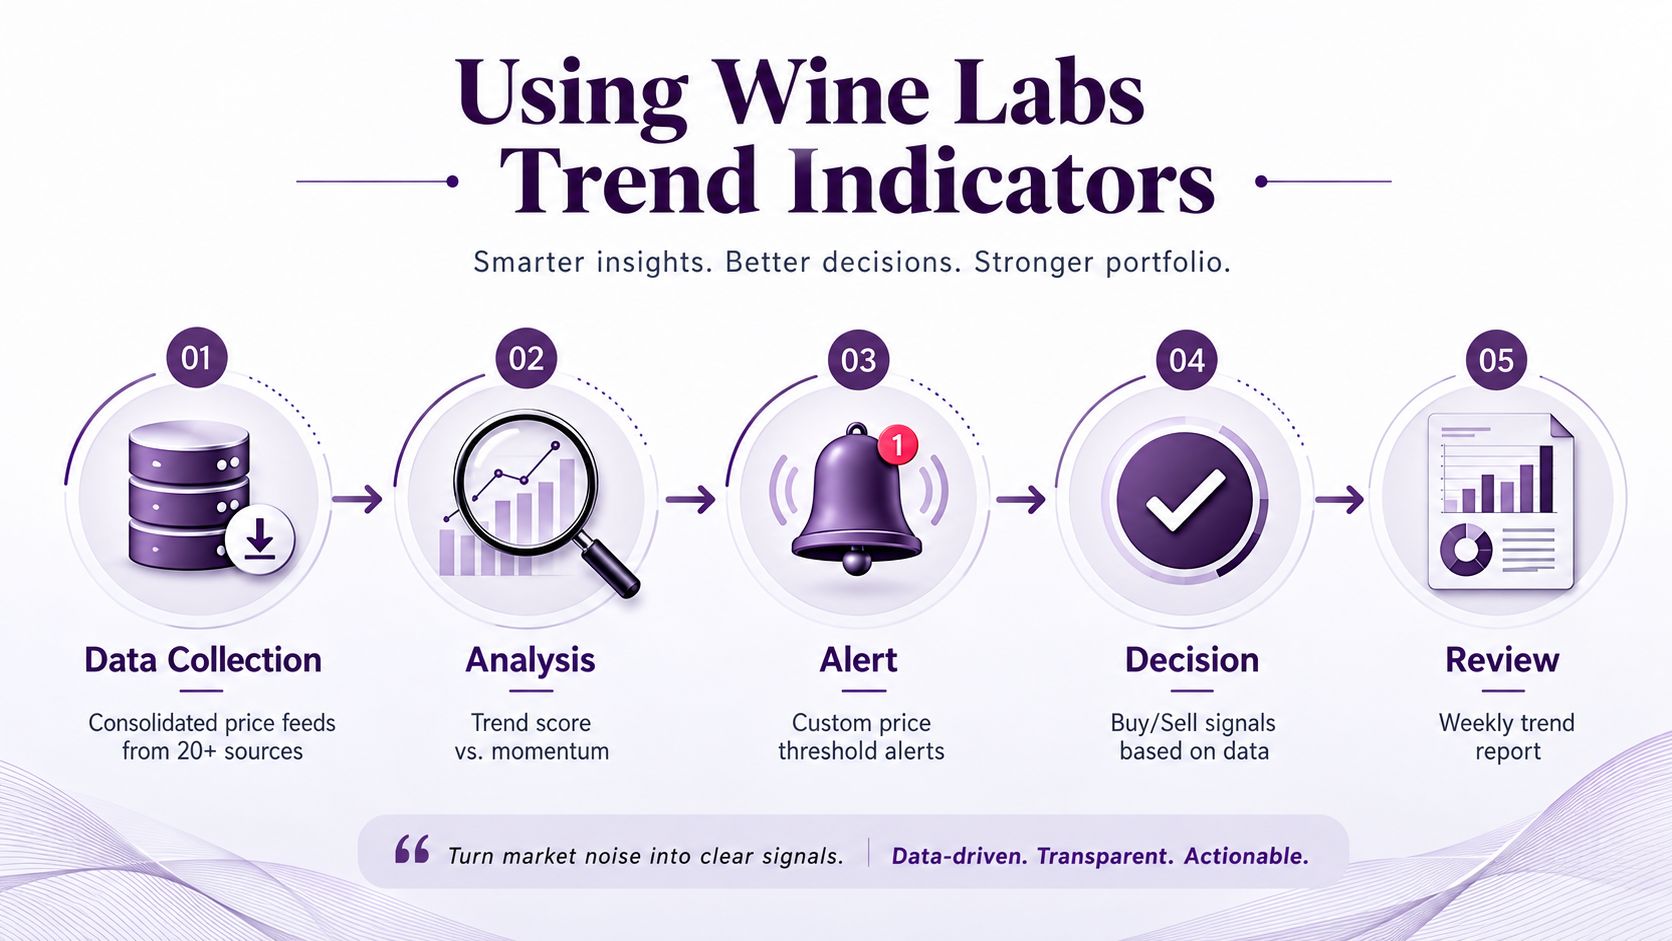
A data-first workflow starts with comparable pricing, not with instinct. Wine Labs consolidates real-time pricing from retail, auction, exchange, and restaurant channels into one view, which is what you need before quoting, buying, or selling in a market where the same label can look different depending on where it's listed. The platform's fine wine market data feature is built for that kind of cross-channel comparison, and that matters more than a single benchmark when pricing is fragmenting by region and vintage. Wine Labs fine wine market data
The practical value is simple. If you're checking a producer, first compare it across channels. If the auction track is moving ahead of retail, that tells you one thing. If restaurant offers are holding while exchange offers soften, that tells you something else. Those gaps are where commercial decisions get sharper, because you're no longer guessing whether the market is broadly strong, you're reading where the pressure sits.
<a id="a-practical-workflow-that-merchants-can-actually-use"></a>
A practical workflow that merchants can actually use
-
Pull the comparable set first. Start with like-for-like bottles, vintages, and formats. Canonical identity matching matters here because messy listings can hide duplicated wines and distort your pricing view.
-
Read the trend indicator beside the benchmark. A raw price isn't enough on its own. Compare it against the broader market line so you can tell whether a move is isolated or part of a broader repricing.
-
Set alerts on movement thresholds. Real-time ingestion and configurable alerts help you react before a stale spreadsheet becomes a bad quote.
-
Check the inventory view. Cellar Pricer and the portfolio tracker are useful when you need to value a file or review stock against current market context.
-
Review the weekly pattern, not just the day's move. That's where gainers, declines, and broader context start to tell a coherent story.
For a deeper framework on how to interpret moving averages, momentum, and directional change, the trend analysis methods guide is a good companion read because it focuses on how to separate noise from trend. In fine wine, that skill matters because a single strong listing can look meaningful until you place it against the wider channel picture.
The best use of trend tools isn't prediction, it's faster correction of bad assumptions.
If you're scaling this process across a buying team, the value compounds. Real-time alerts reduce lag, benchmark views reduce overpaying, and portfolio tools make it possible to value stock without waiting for manual reconciliation.
<a id="building-a-data-first-approach-to-fine-wine-markets"></a>
Building a Data-First Approach to Fine Wine Markets
A data-first strategy is no longer optional in a market this fragmented. The last few years proved that regional divergence, microstructure signals, and cross-channel pricing gaps can all coexist, and they can't be understood properly if your only input is a headline index. The merchants and investors who do best in this environment are the ones who treat each bottle as a data point with context, not as a generic label with a price tag.
That means three habits need to become standard. First, compare prices across channels before making a move. Second, watch liquidity signals such as bid depth and buyer-initiated trading, because they often turn before the broader market does. Third, pay attention to where demand is migrating geographically, because the buyers who matter tomorrow may not look like the buyers who mattered five years ago.
The technical foundation matters too. Canonical identity matching reduces duplicate records and prevents false comparisons. Real-time ingestion shortens the time between a market shift and a commercial response. Curated auction and news digests help merchants catch catalysts early instead of learning about them after spreads have already moved. If you're building that kind of workflow internally, the overview on data sourcing for AI and BI is a useful reference for thinking about how structured data inputs support repeatable decisions.
The market isn't asking anyone to predict every move correctly. It's asking them to be less late, less exposed to stale assumptions, and more selective about where they deploy capital. That's especially true now, when prices can still sit well below prior peaks while participation, breadth, and bid quality are already improving in specific pockets.
If you want to price, source, or value fine wine with less guesswork, visit Wine Labs and explore how its cross-channel data, trend indicators, and portfolio tools can help you read the market with more precision.